New SiteSage App
Sensors,
Meters, and Apps
The new SiteSage app presents a fresh look on energy insights for buildings. Learn how important aspects of the app have changed, including:
- Power, Energy, and Water Charts
- Data Export
- Sensor Charts
- License and Location Information
- Device Settings
- Alerts
- Navigation
Power Charts
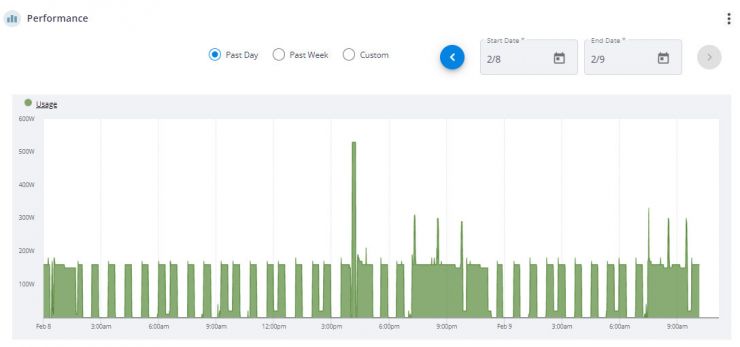
The snapshot page charts overall power use for the building by default. Power data is best viewed by day and shows minute data. When viewing a larger date range, the power data is averaged.
Energy Charts
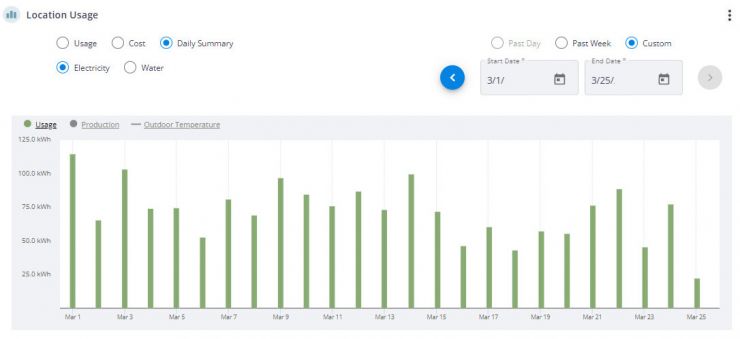
If you expand the date range, the daily summary radio button becomes active. Select it and then view energy (kWh) use totals by day.
Water Use
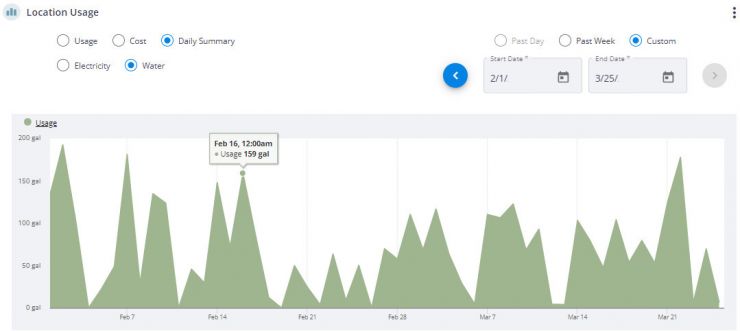
If you monitor water use in SiteSage, expand the date range and select daily summary and water.
Data Export
Data can be exported from the chart on the bottom of the utilities page (same chart discussed above). Click on the three dots and select export. If an error message appears, try a smaller date range.
Equipment Power Charts
This same chart can be changed (using the three dots) to show power use by equipment. This chart is great for showing what contributes to peak demand.
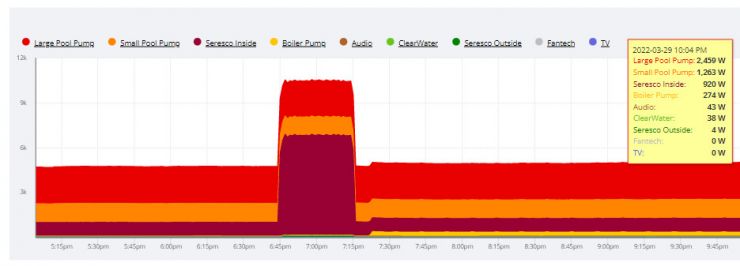
This chart on the utility page can also be used to export data. Click the three little dots to select export. Try smaller date ranges if error messages appear. Also try logging into legacy.sitesage.net if you have problems exporting from the new platform. Equipment-specific data exports are possible by viewing the equipment page and clicking on the export tab.
Equipment Energy Use
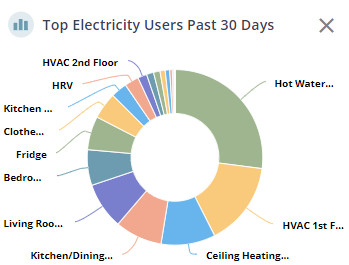
The utilities page has a pie chart for energy by equipment over the last 30 days.
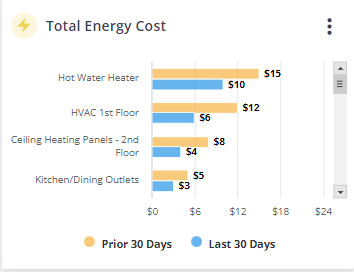
There is also a total energy chart that shows energy by equipment, for this month and previous month. This chart can be configured to show energy use during regular hours, after hours, or total energy use. Click the three little dots to change what is reported.
Sensors and Flow Meters
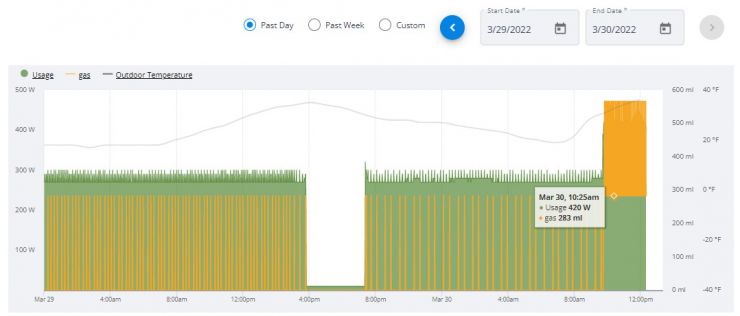
Sensors and flow meters appear on the Data Source tab. A small chart shows the last 24 hours of sensor data. For more powerful charting, associate the sensor or flow meter with a piece of equipment. Within the data sources tab, click on the sensor header and then click the associate link. Select the equipment. Then navigate to the equipment page, click on the history tab, and click the 3 dots. Click the box for the sensor or flow meter data, and see it charted.
Device Settings
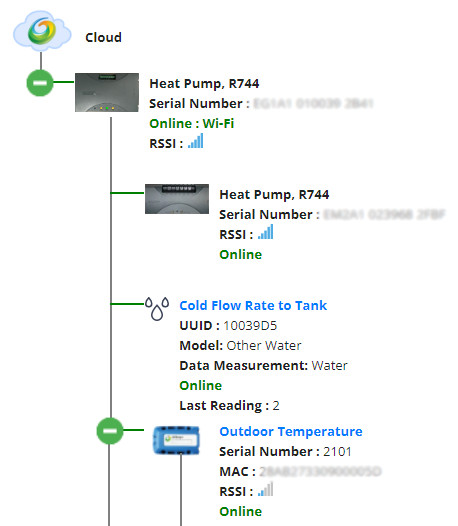
Click on the connectivity tab and see the gateways, electricity meters, sensors, and other devices associated with the location. Click on any device and view communication, serial numbers, and settings. Clicking on the electricity meter accesses the circuit and current transformer (CT) settings.
Alerts
SiteSage alerts focus on equipment health, energy savings, safety, and connectivity. Select the alert, the user, and then the delivery method (email or text).
Account Status
Near the top of the page is the location name. Click on the pencil icon to the right and you can access the location and license information.
Navigation
The new SiteSage app provides instant access to energy and dashboard settings. The left hand navigation manages the location, account, users, alerts, and reports. The main part of the page provides deeper access. The top pulldown menu allows navigating within these categories. When viewing a location, the top navigation selects change the location or quickly view an equipment page.
Powerful Energy Insights
SiteSage provides great insight into what contributes to energy bills. Plus, the platform keeps an eye on equipment and temperatures. The remote monitoring combined with proactive alerts offer a valuable awareness for buildings. The new platform aims to support healthy and efficient buildings with flexible reports and improved navigation. The older version will be available at legacy.sitesage.net for a limited time.
Recent Posts
About PowerWise
PowerWise is a proven innovator of monitoring and control technology.
